
Dette innlegget er en oppfølger til det jeg skrev om cirrostratus-dekket som Apollo 11/Saturn V trengte gjennom 105 sekunder ut i ferden i innleggene Apollo 11 – Saturn V med strikkmotor? og Apollo 11 – Saturn V med strikkmotor – Del 2. Jeg forsøker ikke å bevise noe. Det er kun ment som et forsøk på å sette fokus på et tema som muligens ikke er så enkelt å forstå som man gjerne skulle ønske det var.
Tropopausen er viktig i denne sammenheng (Apollo 11) fordi at selv om cirrus-skyer kan dannes vesentlig lavere enn de aktuelle høydene beskrevet av meg tidligere, så ser toppene av blant annet cirrostratus å variere med høyden på tropopausen.
Varmeforflytningen i troposfæren er dominert av fordampning/konveksjon, mens stråling blir keiseren (uten behov for nye klær) i den vannfattige stratosfæren. Cirro-skyer er egentlig ikke skyer i den forstand at disse kan betegnes som vann/vanndamp. Cirro består av iskrystaller, og da vann er mangelvare i stratosfæren, får det heller ikke blitt nevneverdig produksjon av iskrystaller å så sterk grad at de blir skylignende.
Det som derimot kan heve grensen for cirrostratus-skyer er høyden på tropopausen, eller med andre ord, tykkelsen på troposfæren. Denne varierer etter breddegrader og årstider, og er tynnest ved polene om vinteren, og tykkest ved ekvator og de subtropiske områder om sommeren. Høyden på skydekket (cirrostratus) over Florida kan variere både utfra meteorologiske forhold og årstid, og er derfor vanskelig å sette en bestemt høydegrense for. Det finnes allikevel data å forholde seg til.
Troposfære, tropopause og stratosfære
Når det gjelder skillet mellom troposfæren og stratosfæren finnes flere definisjoner, og navnet dette skillet er gitt er tropopausen. En måte å definere skillet er temperaturstigning. En annen er lufttrykk. En tredje er en rask reduksjon i luftfuktighet. E. M. Smith (Chiefio) har skrevet en glimrende artikkel om deler av disse problemstillingene i forbindelse med termodynamikk (varmeforflytning) relatert til klimavitenskapen.
E. M. Smith – Tropopause Rules
Vi bor på en vannplanet, og det er dette vannet som gir oss den viktigste delen av atmosfæren som skal til for å gi oss vær. Alle sitatene under er fra Smith.
Atmosphere, Stratosphere, Mesosphere, Troposphere
My kingdom for a sphere…
We all know what a sphere is. It is a nice round ball. Radius substantially equal in all directions. The use of “sphere” in all those terms about the air layers of our planet is a lie. I’d like to make it prettier than that, but I can’t. “Reality just is. -E.M.Smith”. It is a pernicious lie that invades our understanding and corrupts the ability to see what is really happening. Yet the constraints of language force me to use those words. OK, but at least we can set a “That is a lie” marker on the “sphere” part of the words. From this point forward, when you see “Stratosphere” think “That’s a ‘polite lie’ and it’s really StratoBand”.
…
For the StratoBand in particular, we have a clear visible case that demonstrates the lie in Stratosphere. During the winter, the polar TropoBand is essentially zero and the StratoBand extends to the surface. In essence, the TropoBand ought to be seen as a 3/4 sphere (or so) that wobbles back and forth from one end of the planet to the other. Similarly, the StratoBand ought to be seen as a 3/4 sphere (or so) that is touching one pole in a polar vortex and rising up, spinning as it goes, spreading out toward the other pole – thinning all the way. As the year progresses, this spinning vortex like band shifts from anchored at one pole to anchored at the other (so at some mid-point might well be a momentary sphere…)
You can see that ‘shifting’ in this movie of how net radiation changes over time.
Now we have a much more accurate dynamic mental model of what’s going on. No longer thinking in terms of fixed onion layers, but in terms of a spinning elastic band that surges back and forth from pole to pole. Rising and falling as it goes. That’s more nearly what really happens.
For the Tropo”sphere” it’s even more complex. It rises and falls in bands as it goes from equator toward the warm pole. These are the “Hadley Cells” and “Ferrel Cells” and “Arctic Cells”. How can something be a sphere when it is divided into at least 3 major zonal bands, each of different heights and with different dynamics, with discontinuities between them, and with a major ‘wobble’ back and forth between poles? We really have 3 different TropoBands to think about (or think in terms of).
What IS the Tropopause?
In the various definitions, you get a confusing mush of things. It’s the point where the lapse rate goes from positive to negative. Or it’s the place where the water vapor runs out and ozone begins. Or it’s a particular lapse rate. Or….
All well and good. But…
What does the Tropopause MEAN
Every physical thing has some meaning. Some hidden truth. Just slapping a definition on something and ‘moving on’ rarely illuminates that meaning. Like saying “Bob is a cop”. OK. We know a little something about Bob. But is he a Narc? A homicide detective? Did he become a cop for the pension or because he likes adrenalin? What is the ‘inner meaning’ of “Bob The Cop”? For the Tropopause we hear “it is where the troposphere ends and the stratosphere begins. As though it is just some definitional artifact of two nice round ball layers.
But it isn’t.
First off, since the StratoBand comes to near ground level in polar winter, so must the TropoPause. It, too, is complicated. Second, since the TropoBandS have various heights, the TropoPause must also. Finally, since a variety of physical properties / markers change AT the TropoPause, it must be indicating something interesting about “what changed?”.
…
Fra Wiki, sitert av forfatteren: “The lower stratosphere receives very low amounts of UVC, thus atomic oxygen is not found here and ozone is not formed (with heat as the byproduct). This vertical stratification, with warmer layers above and cooler layers below, makes the stratosphere dynamically stable: there is no regular convection and associated turbulence in this part of the atmosphere. The top of the stratosphere is called the stratopause, above which the temperature decreases with height.”
The stratosphere is simply the place where convection is not important. The place where radiation is the dominant form of heat transfer and where radiative physics matters.
In short, the Troposphere is where convection and evaporation / condensation dominate. Driven by ground heating. Radiation simply does not matter here. Any ‘ground heat’ is rapidly taken up by convection and evaporation / precipitation, lofted to the height where radiation takes over, and dumped. We see that every day with the daily temperature cycling in response to 0 to 1400 (ish) W/m^2 solar flux variations.
Now we can start to see what the Tropopause is telling us. It is telling us the point at which convection and precipitation have ‘done their job’ and moved the heat. It is telling us exactly where radiative physics can take over. Where the ‘heat engine’ has run down and mass movement runs out of energy.
A higher tropopause means more heat is landing on the surface. A lower tropopause means less heat is landing on the surface. It’s really that simple. We can directly measure surface heat via tropopause height. We can even see this in no uncertain terms. At the arctic in winter, there is no surface heating. The tropopause crashes into the ground. At the Equator there is strong surface heating. The tropopause is at the greatest height. Yet there is more… Thunderstorms have what is called “overshoot”. (Another broken term, IMHO). The surface heating is so large that a huge run of wet air shoots up and crashes right on through where the tropopause layer ‘ought’ to be. In my view of things, it is simply locally lifting the tropopause at the point were there’s a bit more convective / precipitation work to do to dump some extra heat to the radiative zone… Again, directly reflecting the heat load at the surface below. (This is confirmed, IMHO, by the way storms leave a cool track in their wake that is lacking in convection / precipitation…)
Dette med konveksjonsceller og forhøying av tropopausen er et viktig poeng, og problematikken med å sette en reell (fast) høyde på cirro-skyer blir også nevnt av forfatterne av boka Cirrus under. Før jeg går videre med stoff derfra gjør jeg oppmerksom på at flere av deres eksempler er fra Midtvesten, og således ikke kan overføres direkte til Florida som ligger lenger syd og som ved hjelp av Mexico-Golfen og den varme Atlanteren må kunne kalles den kraftige konveksjonens kongedømme. Les: Høyere gjennomsnittlig tropopause og således høyere cirro-lag. Ha dette i mente før du går videre.
Om cirro fra forskere
På side 26 i denne gratis Gogle e-boka om cirro-skyer
Cirrus
David K. Lynch,Kenneth Sassen Department of Meteorology University of Utah,David O’C. Starr Department of Meteorology NASA Goddard Space Flight Center,Graeme Stephens Department of Atmospheric Science Colorado State University
har jeg hentet en illustrasjon som forfatterne har konstruert ved hjelp av FARS-datasettet blant annet ved bruk av LIDAR-målinger.

En illustrasjon fra s. 22:

Fra s. 24:

Fra s. 25:
Fra s. 26:

Fra s. 27:

Det er verdt å merke seg at den økte høyden på cirrus-skyer om sommeren først og fremst ser ut til å gjelde toppen av skydekket, ikke basen.
Om temperaturen på bunnen og toppen av cirro-skyene i troposfæren, s. 28:

Dette med stadig synkende temperatur pr. høydemeter er en av definisjonene på troposfæren. I stratosfæren er det motsatt, med stigende temperatur jo høyere en kommer.
http://apollo.lsc.vsc.edu/classes/met130/notes/chapter1/vert_temp_all.html

Så et eksempel, ganske grovt, av tropopauseprofilen etter breddegrad:
http://apollo.lsc.vsc.edu/classes/met130/notes/chapter8/trop_hght.html

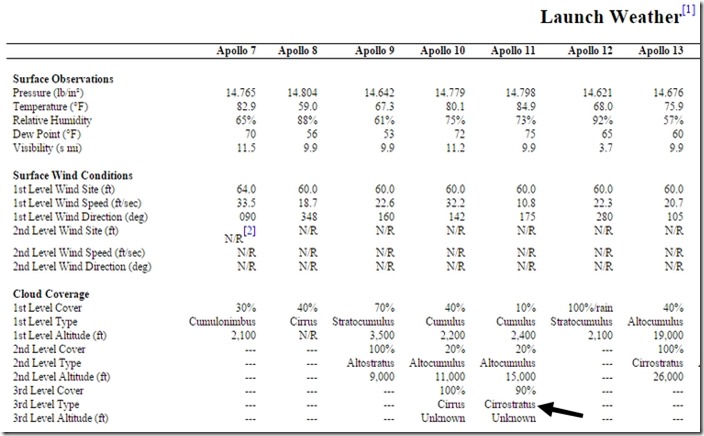
Jeg minner om at Kennedy Space Center ligger i den 29 breddegrad, at oppskytingen av Apollo 11 skjedde den 15. juli, samt meteorologiske data for dagen fra NASA, som ytterligere kan ha hevet cirrostratus i forhold til de tallene jeg forholdt meg til i de to første innleggene.
Forskning direkte relatert til Cirrus over Florida
Innlegget avsluttes med stoff fra Florida-relatert forskning, og en liten oppsummering.
http://onlinelibrary.wiley.com/doi/10.1029/2004JD004671/pdf
Formation of a tropopause cirrus layer observed over
Florida during CRYSTAL-FACE
Jensen, E., L. Pfister, T. Bui, A. Weinheimer, E. Weinstock, J. Smith, J. Pittman, D. Baumgardner, P. Lawson, and M. J. McGill (2005), Formation of a tropopause cirrus layer observed over Florida during CRYSTAL-FACE, J. Geophys. Res., 110, D03208, doi:10.1029/2004JD004671.
[1] On 13 July 2002 a widespread, subvisible tropopause cirrus layer occurred over the Florida region. This cloud was observed in great detail with the NASA Cirrus Regional Study of Tropical Anvils and Cirrus Layers–Florida Area Cirrus Experiment (CRYSTAL-FACE) instrumentation, including in situ measurements with the WB-57 aircraft.
…
Figure 2 shows time series of the ER-2 nadir Cloud Physics Lidar (CPL) [McGill et al., 2004] backscatter as well as the WB-57 altitude and
in situ measurements of particle surface area and nitric oxide. The tropopause cloud layer was present at 1 – 2 km below the cold-point tropopause throughout the flights. During much of the WB-57 flight, it was dipping into the top part of this cloud layer. The enhancements in particle
surface area density (SAD) associated with ice crystals are apparent during the times when the WB-57 was in the cloud layer.

Figure 2. Tropopause cloud structure shown by the ER-2 nadir CPL lidar measurements of total attenuated backscatter at 532 nm. The red line indicates the WB-57 altitude, the in situ measurements of particle surface area density (mm2 cm3 ) are shown in white, and the NO concentration measured on the WB-57 is shown in cyan. The times when the aircraft dipped into the cloud correspond to enhancements in particle surface area associated with ice crystals.
Oppsummering
Det har blitt tre ganske omfattende innlegg om NASAs banedata og meteorologiske forhold i forbindelse med Apollo 11-ferden.
Det hele dreier seg om disse innleggene og dataene og meteorologien som er lagt til grunn dokumenterer at NASA i ettertid forfalsket dataene for ferden i troposfæren og stratosfæren. Er det sannsynliggjort at NASAs påstand (indirekte) om at Apollo 11 fløy gjennom cirrostratus ved 24.000 meters høyde er gal? Kan skydekket virkelig ha befunnet seg så høyt?
Min oppfatning er at muligheten for at cirrostratus-dekket befant seg i 24.000 meters høyde er usannsynliggjort. I så fall lyver NASA gjennom å presentere forfalskede data. Det sannsynlige resultatet av dette er at Apollo 11 aldri forlot atmosfæren, men styrtet et eller annet sted i Atlanterhavet. I og med dette, mener jeg også at en videre debatt om Apollo-programmet må ta dette i betraktning.
Det finnes en del kildemateriale i forbindelse med muligheten for at Apollo V-raketten hadde muligheten til å kompensere for den dårlige starten på ferden. Jeg har valgt å ikke gå nærmere inn på dette i de tre innleggene jeg har skrevet, men ønsker allikevel å nevne at jeg kontaktet Norsk Romsenter for å få deres mening om dette.
Apollo 11/Saturn V
4. november 2014 13.55 414 KB
Fra: Jostemikk
Til: spacecentre@spacecentre.no
Hei!
Jeg har noe jeg lurer på og derfor spør om angående DOCUMENTNO. D5-15560-6
TITLE APOLLO/SATURN V POSTFLIGHT TRAJECTORY – AS-506
Diagrammet under er fra NASA og viser hvor raketten var til en hver tid mens den fortsatt befant seg i atmosfæren.
Det dreier seg om tidspunktet 105 sekunder ut i ferden, og igjen bruker jeg et originalt NASA-diagram, men denne gangen har jeg markert tidspunktet 105 sekunder ut i ferden, da NASAs egne data forteller at raketten hadde nådd 23.999 meter. Dette er altså NASAs Post Trajectory-data:
Så til spørsmålene. Hvis trinn 1 på Saturn V-raketten hadde feilet, slik at den ga for lite skyvekraft og raketten 105 sekunder ut i ferden kun hadde nådd en høyde av 33-50 % av oppgitt høyde på 23.999 meter, ville raketten allikevel ha kunnet nådd ut til bane rundt jorda? Hadde de nok backup-power i resten av trinn 1 eller hele trinn 2 til å kompensere for den dårlige starten? Hvis ikke, ville ferden da ha endt i Atlanteren med et plask og en katastrofe?
Vennlig hilsen Jostemikk


Norsk Romsenter har valgt å ikke svare på min henvendelse.